AI Monitoring Proxy is becoming essential as businesses scale their AI workloads, especially when teams depend on AI systems every day. Modern AI and LLM-powered systems rely heavily on a strong proxy layer for routing, load balancing, cost control, and governance.
That’s why monitoring this layer is important for reliability, security, and responsible AI use. This article from 9Proxy will give you a complete breakdown of how AI Monitoring Proxy works, the tools you can use, and step-by-step setup instructions for teams scaling AI systems across high-traffic environments.
What is AI Monitoring Proxy?
An AI Monitoring Proxy is a smart middle layer that stands between your apps and the AI models you use. Instead of sending requests straight to AI providers, the proxy acts like a gatekeeper; it checks latency, errors, token usage, costs, and unusual activity. It also applies security rules and keeps everything running safely and smoothly.
Because today’s AI systems often use many models and providers, this proxy gives you one place to monitor performance, avoid failures, and keep AI costs predictable.
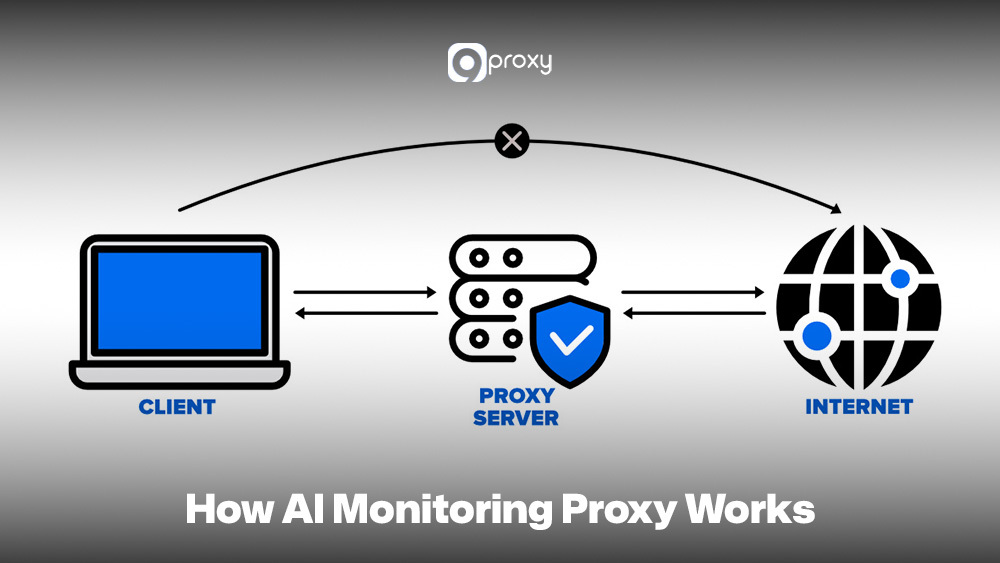
How AI Monitoring Proxy Works
The operation of an AI Monitoring Proxy focuses on how it intercepts and manages traffic between your application and the AI models. To monitor the system well, you need to understand each step of the flow.
First, your app sends a request to the AI Proxy. At this point, you mainly check request latency and authentication. Next, the AI Proxy applies its logic, such as routing to the best model, caching repeated requests, limiting traffic, and recording logs. This is an important monitoring stage because it handles policies, routing accuracy, and proxy performance.
The proxy then forwards the request to the selected AI model. Here, monitoring focuses on provider latency and errors. When the model responds, the proxy may filter or adjust the output, track token usage, and calculate cost.
Finally, the proxy returns the response to your app. You monitor end-to-end latency and delivery reliability. Monitoring every stage helps you spot bottlenecks, control token costs, and ensure stable, accurate request handling.
Practical Use Cases for AI Monitoring Proxies
AI Monitoring Proxies play an important role in many industries because they help control, track, and optimize AI deployments. In many real-world proxy use cases, monitoring becomes the layer that connects infrastructure control with intelligent model orchestration.
- AI Monitoring Proxies: These are widely used because they help control, track, and optimize AI deployments across industries.
- AI in Cloud Infrastructure: Proxies manage data flow and monitor costs for services like AWS SageMaker or Google AI. They centralize logs and billing data so teams can easily track spending.
- AI in Healthcare: Proxies monitor latency and errors in real-time tasks such as medical image analysis. They also protect patient data by masking or pseudonymizing sensitive information before sending it to the model.
- AI in Financial Services: Proxies support high-volume systems like fraud detection. They enforce rate limits, keep detailed audit logs, and monitor model performance to maintain strong identification accuracy.
- AI for Autonomous Systems: In vehicles or robotics, proxies track performance in real time. They handle failover between model providers and balance workloads to ensure fast, reliable decision-making.
AI Proxies vs Traditional Proxies
While both AI proxies and traditional proxies sit in the middle of a system, their functions and goals are very different. Traditional proxies mainly forward traffic, while AI proxies focus on monitoring, optimization, and control for AI workloads.
Below is a simple breakdown showing the key differences between an AI Monitoring Proxy and a Traditional Web Proxy.
| Feature | Traditional Proxies | AI Monitoring Proxies |
| Core Purpose | Forward traffic | Forward + analyze + optimize AI workload |
| Telemetry | Basic logs | Deep AI metrics (latency, tokens, cost) |
| Routing Logic | Static/conditional | Dynamic, model-aware routing |
| Context Handling | None | Request enrichment, prompt handling |
| Cost Visibility | None | Token and cost tracking |
| Reliability Tools | Basic retry | AI-specific fallback, throttling, and load balancing |
| Governance | Low | Policies for model usage, guardrails, and access control |
Traditional proxies are often used for tasks like filtering traffic, caching content, or acting as a proxy for blocked sites in restricted environments. AI Monitoring Proxies go further by analyzing model behavior, measuring inference cost, and enforcing usage governance at the application layer.
Tools and Platforms for AI Proxy Monitoring
To set up an AI Monitoring Proxy effectively, you need tools that can handle API gateway tasks, collect detailed telemetry, and visualize data clearly.
Datadog
This is a strong all-in-one monitoring platform. You can send proxy logs and metrics such as token usage, prompt size, and latency directly to Datadog. It’s an APM feature that traces each request from the proxy to the LLM and back, giving you full visibility into performance and cost.
Kong API Gateway
Kong is an open-source API gateway widely used for routing and management. With its plugin system, you can turn Kong into an AI Monitoring Proxy by adding rate limiting, authentication, and custom routing logic. It can also push AI-related metrics to your monitoring tools.
Prometheus and Grafana
These two open-source tools work together as a popular monitoring stack. Prometheus collects metrics exposed by your AI proxy, such as request volume or model-specific error counts. Grafana then displays these metrics as live dashboards so you can watch latency, cost, and usage patterns in real time.

Other Platforms
Cloud providers also offer useful tools. AWS provides Amazon API Gateway for routing and CloudWatch for monitoring. Google Cloud offers Cloud Endpoints and Cloud Monitoring. Both can be configured to act as or support an AI Monitoring Proxy setup.
For teams already using specialized proxies such as an ecommerce proxy for product data collection or an ad verification proxy for monitoring digital campaigns, integrating AI-level telemetry into those proxy layers helps unify business intelligence with model analytics.
These tools give you the visibility and control needed to run AI infrastructure smoothly and efficiently.
Setting Up Monitoring for Your AI Proxy
To build a good monitoring setup for your AI Monitoring Proxy, you need to follow a clear, simple process. In the next sections, we’ll show you the main steps so you can easily track and understand everything happening in your AI workflows.
Pre-Deployment Checklist
Before launching your AI Monitoring Proxy and sending real traffic through it, make sure you have the following items ready:
- Provider/Model-Routing Configuration: Set clear rules for how requests are routed. For example, send complex tasks to GPT-4 and simple tasks to a cheaper, faster model.
- Logging Design: Decide what information you will log for each request, such as user ID, prompt length, token count, cost, chosen model, and response time. Store all logs in one place so they’re easy to search.
- Alert Thresholds: Set limits for important metrics, like latency above 5 seconds, error rate over 1 percent, or daily costs passing a certain amount.
- Provider Selection & API Keys: Make sure all API keys for your AI providers are safely stored and correctly configured.
Step-by-Step Monitoring Setup
Setting up full telemetry for your AI Monitoring Proxy is the most important part of building good observability.
- Configure Request Tracing: Add distributed tracing such as OpenTelemetry so you can follow each request from the client to the proxy, then to the model API, and back again. This helps you measure latency at every step and find where slowdowns happen.
- Integrate Structured Logging: Make sure the proxy logs everything in a clear, machine-readable format like JSON. Key details include token usage, cost, response summaries, and which model was used.
- Build Performance Dashboards: Use tools like Grafana or Datadog to create dashboards showing the main signals of your AI Monitoring Proxy. Track latency, traffic, errors, saturation, cost per request, and model failover activity in real time.
- Set Up Alert Configuration: Use your alert thresholds to create automatic notifications. Your team should be alerted right away through email or PagerDuty if there are cost spikes or high error rates from a provider.
With full telemetry in place, your team can clearly see the proxy’s performance and cost trends.
Testing Your Monitoring System
After deploying the proxy, you need to test whether your monitoring setup works well under normal and stressful conditions.
- Synthetic Traffic Injection: Run scripts that send continuous test traffic to make sure logs and metrics are being collected correctly.
- Load Testing: Send high-volume traffic to simulate busy hours. Check that your monitoring system still reports accurate performance.
- Chaos Injection: Intentionally create small failures, such as disabling a model provider or adding a routing error. Confirm that alerts trigger correctly and dashboards show the failover or outage.
- Log Inspection: Review random logs to ensure they include all required fields such as token counts, cost data, and routing decisions.
Deal with Common Problems in AI Proxy Monitoring
Even with a solid setup, issues can still happen. Here are simple ways to diagnose common problems in an AI Monitoring Proxy.
- Cost Spikes: Check token tracking logs. Spikes usually come from prompts that produce long responses. Identify which request patterns caused the sudden increase.
- Latency Gaps: If overall latency rises, use request tracing to find the slow point. It may be inside the proxy logic or caused by a slow model provider.
- Provider Outages: If one provider suddenly shows zero traffic or very high errors, your monitoring should notice it immediately. Check if the proxy correctly switched traffic to a healthy provider.
- Misconfigurations or Missing Telemetry: If dashboards show missing or incorrect data, check the proxy logs for integration mistakes such as a failed Prometheus connection or errors in the metric format.
Best Practices for Using AI Monitoring Proxies
Following best practices helps your AI Monitoring Proxy deliver strong performance while keeping control, security, and cost efficiency in check.
Centralize and Normalize Telemetry: Gather all logs, metrics, and traces from every AI model and provider into one unified format through the proxy. This removes vendor-specific differences and makes it easier to analyze cost and performance across your whole AI system.
Implement Dynamic, Cost-Aware Routing: Avoid hardcoding model choices. Use the proxy to route requests based on real-time factors such as provider latency, current pricing, and the capability needed. This helps you balance speed, quality, and cost.
Enforce Safety and Governance Policies: Use the proxy to filter prompts and responses. This includes removing personal data from user inputs and blocking harmful or non-compliant content before it reaches the end user.
Utilize Caching for Cost Reduction: Set up caching for repeated queries. When a cached result is returned, the request skips the model call entirely, reducing cost and improving response time.
Apply Fine-Grained Rate Limiting: Set limits per user, per app, or per model to prevent accidental or harmful traffic spikes that could lead to high bills or system slowdowns.
Organizations managing distributed AI workloads often align proxy-layer governance with broader infrastructure standards documented on Blog 9Proxy, where enterprise proxy architecture patterns are discussed in detail.
Future Trends in AI Monitoring Proxies
The world of AI Monitoring Proxies is changing quickly as new model architectures and deployment environments emerge. These proxies will play a bigger role in edge computing and 5G networks, especially where ultra-low-latency AI models run close to the user.
As AI evolves, proxies may start using their own machine learning to adjust routing automatically, predict cost spikes, and make smarter decisions without manual input. This shift will turn proxies from simple traffic managers into proactive, self-optimizing control layers for all AI workloads.
Conclusion
The AI Monitoring Proxy is becoming a critical layer for teams that rely on AI models at scale. It helps you centralize traffic, monitor performance, control costs, and apply consistent security rules across different AI providers.
With the right setup, you gain clearer visibility into your AI workflows and avoid unexpected failures or expenses. By applying the principles in this article, you can build a stable, efficient, and fully observable AI Monitoring Proxy that supports your evolving AI needs. Contact 9Proxy today to explore the residential proxies your AI Monitoring projects require.